Visulization of the single cell RNA-seq dataset
Interactive UMAP, gene and TE featureplot
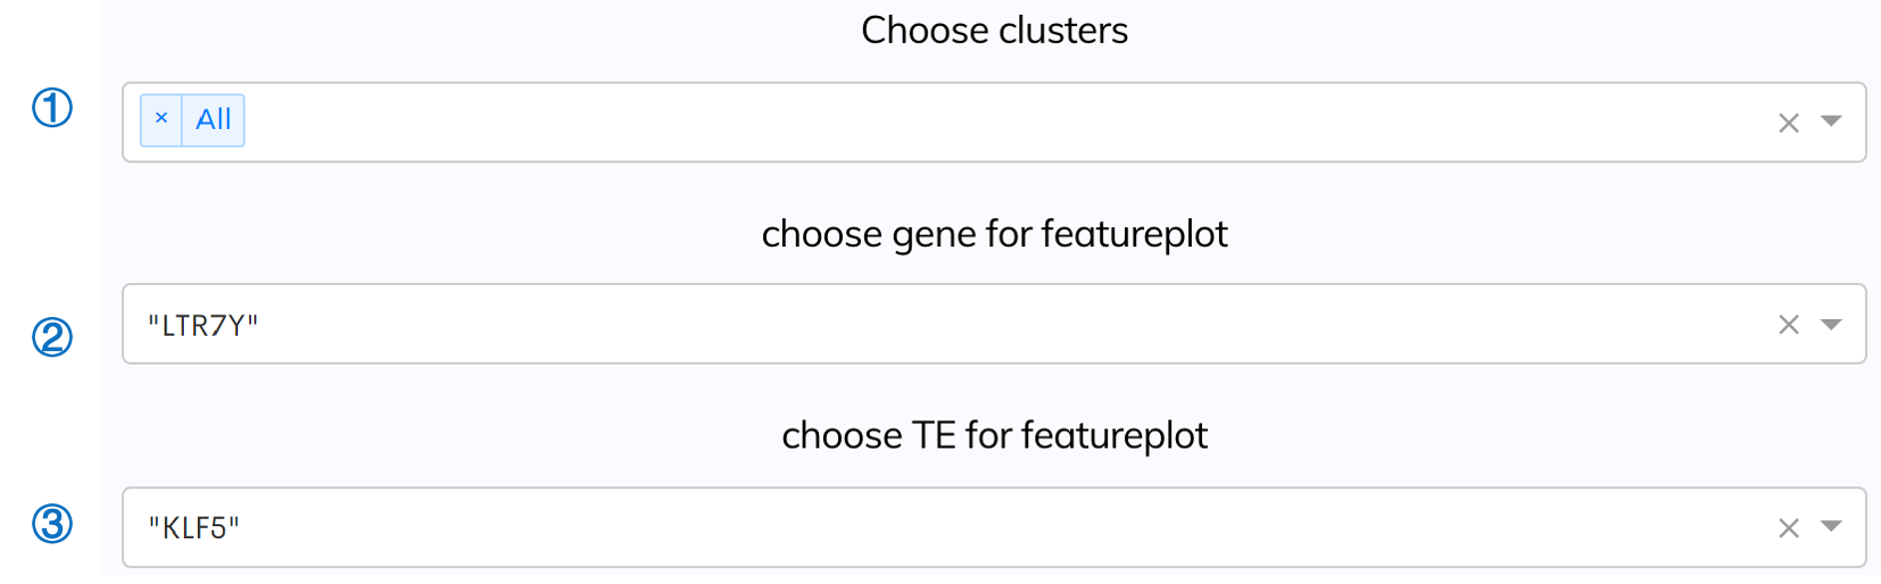
① To obtain the interactive UMAP, you can choose your interested clusters for visulization from the "Choose clusters" dropdown (the default setting is "all").
② To obtain the interactive gene featureplot, you can choose your interested gene for visulization from the "choose gene for featureplot" dropdown.
③ To obtain the interactive TE featureplot, you can choose your interested TE for visulization from the "choose TE for featureplot" dropdown.
④ You can also view and download the average expression level linecharts of all the clusters below.


